Everyone likes fast websites. As a techie running my own blog website, I’m also a little obsessed with speed. But while fast websites may have once been mostly about fast servers and fast network, there’s a whole lot more that’s needed to make a website fast these days.
Studies have shown that users would click away if a website doesn’t load in three seconds. In fact, the study by Gomez and Akamai found that 47% of users expect a web page to load within two seconds. That was from 2011, I believe, so it’s not unreasonable to assume that expectations have increased since.
The Internet just can’t get fast enough, even with faster browsing devices, faster networks, faster servers, and faster technology everywhere. The problem is that just being fast isn’t good enough. I wrote a two-part article on Fixing A Slow Website in 2015, which I think is an interesting read and largely still relevant today almost three years later.
Today, I’m very proud to lay claim to a speed achievement for this blog. Using WebPageTest.org benchmarking tools, ZitSeng.com scores a Speed Index of 370 from a Singapore EC2 location over a simulated FIOS link. The time to first byte is just 144 msec, time to interactive in 257 msec, 484 msec to the onload event, and a full page load completed in 519 msec.
The “Time To Interactive” (sometimes referred to as TTI) is a measure from the start to the time the webpage is sufficiently ready that a user can interact with it.
I selected a pool of well-established (according to me) Singapore-based websites, plus Amazon, for comparison. All of these sites use HTTPS. None came close in terms of speed. Not even half as close.
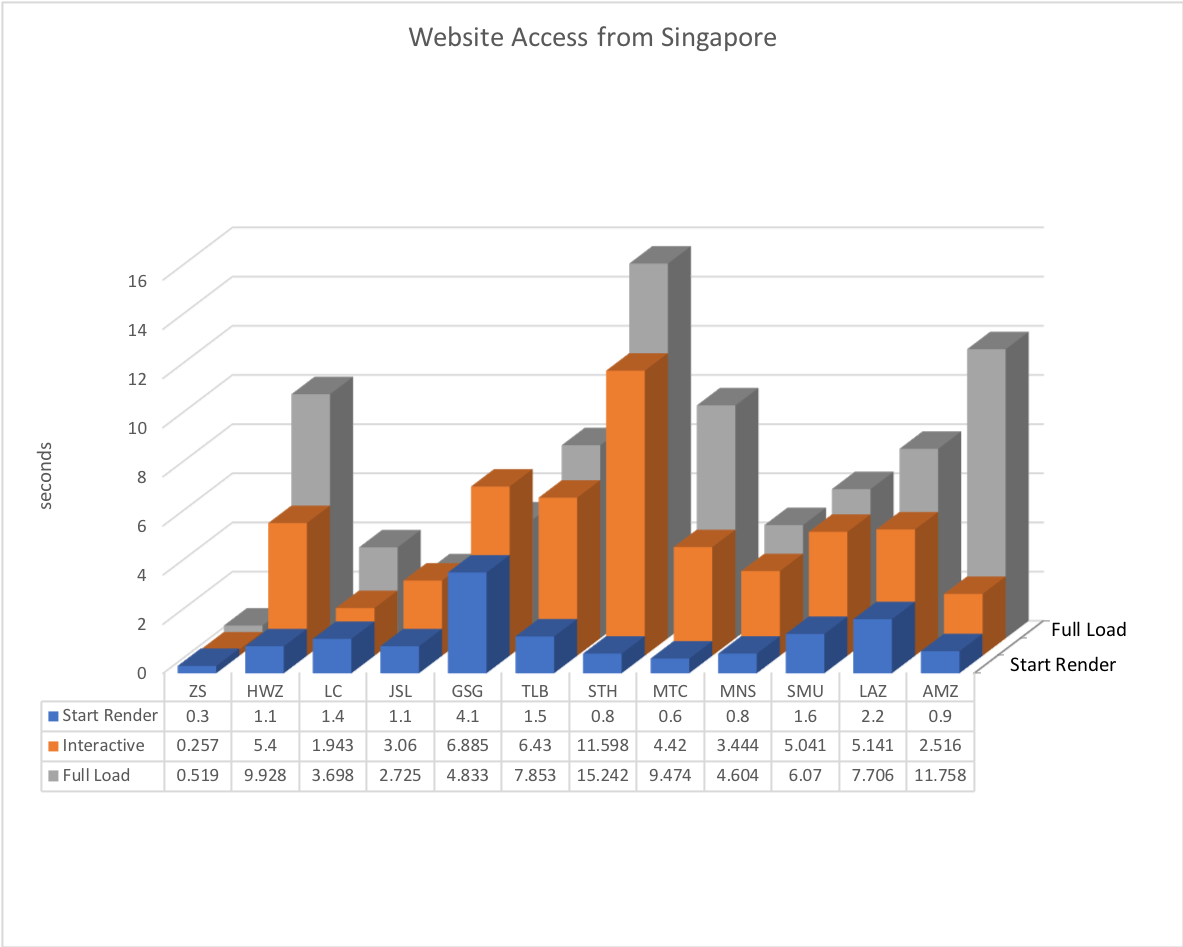
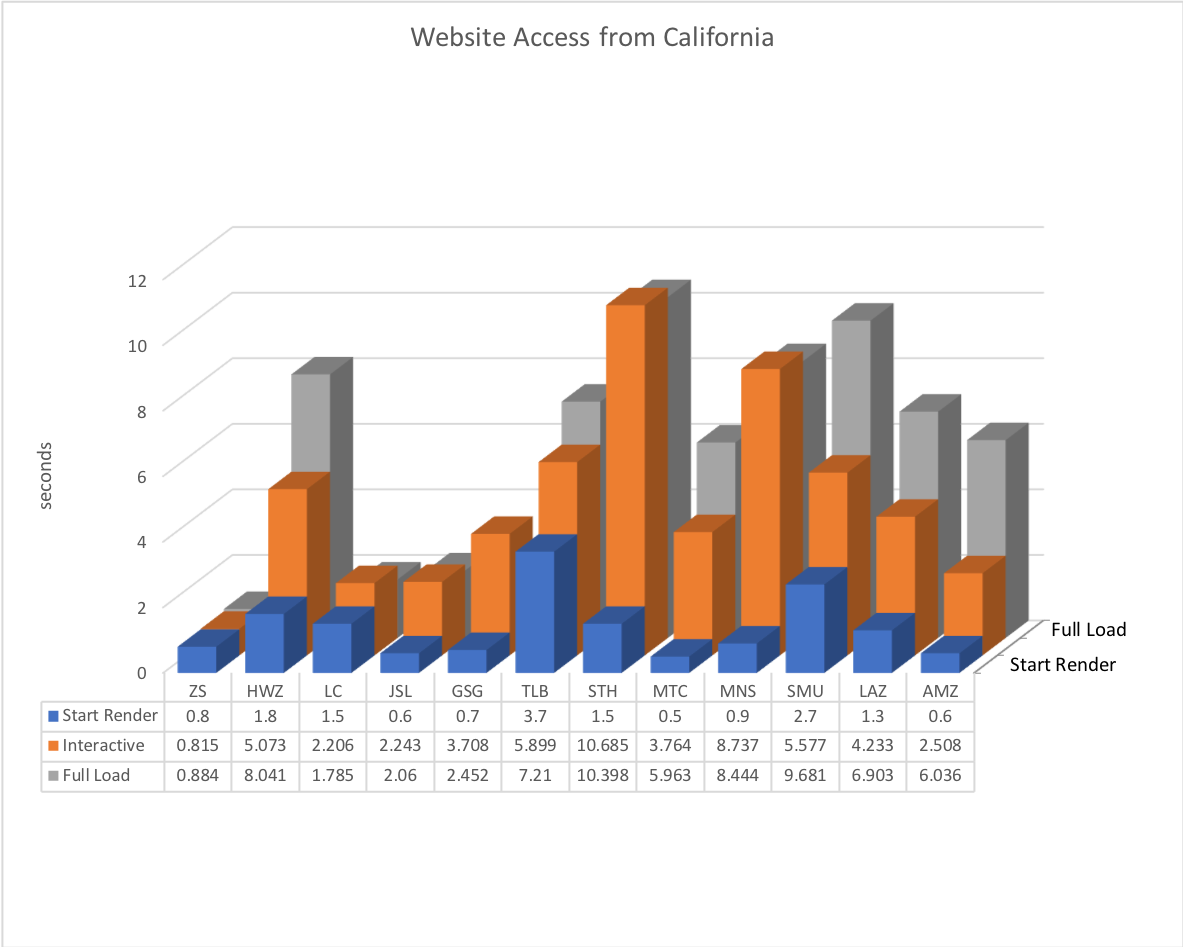
I’ve used some mnemonics in the charts below.The first, ZS, is for this blog ZitSeng.com, and the last AMZ, is for Amazon. I shan’t identify the other websites specifically since it isn’t my intention to start a speed challenge, but perhaps you might be able to make good guesses. All tests are using the Chrome browser, and over a simulated FIOS link.
Here’s the chart for tests conducted from the Singapore EC2 location:

I know some of the numbers look a bit off. For example, the timing for ZS shows a Start Render time happening after the Interactive time. However, I reran these tests and persistently the same strange timings remained that way. I presume there’s just some issue with the way timings are registered on WebPageTest.org.
The next chart is for the test performed from California EC2 location:

There are a few more instances of the Interactive time happening after Full Load. I reran the tests, and as mentioned, the strange timings remained that way.
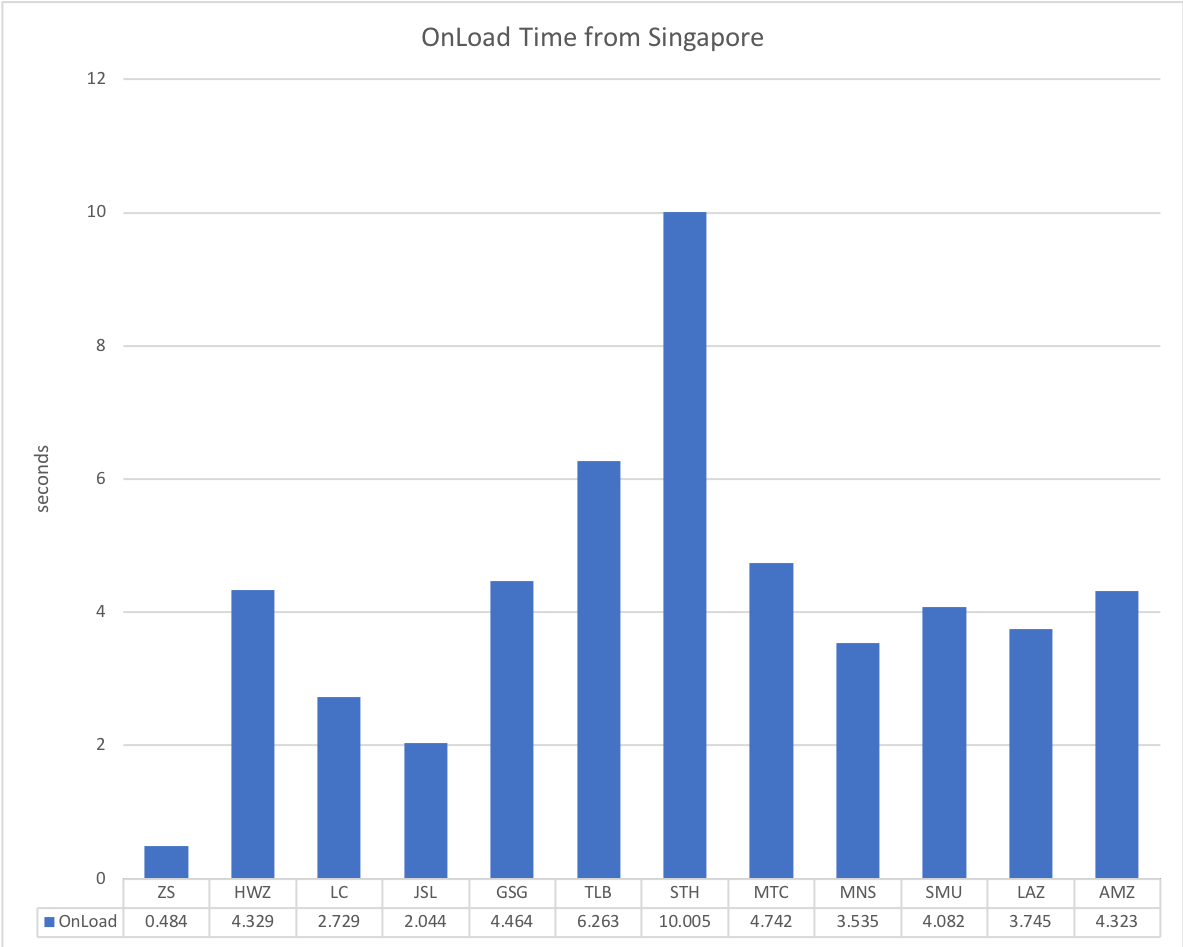
There are other useful metrics, like the browser onload timing. I hesitate to use that because, again, WebPageTest.org shows a very odd result for my website, registering the onload event before before the first page arrived, when tested from numerous locations. The test from Singapore EC2 does make sense, though, so I’m happy to share that here:

Despite a couple of oddities with WebPageTest.org’s reporting, their test results do make sense. For example, I can see from loading my own website, as well as the others, that the network timing trace in Chrome’s developer tools matches the figures from WebPageTest.org.
With the sort of powerful hardware we’ve got these days, and the comparably fast broadband speeds we get in Singapore, the second fastest in the world according to Speedtest, we should get most things in our browser in a snap. However, the figures above show that waiting many seconds is quite normal.
All those waiting often comes down to poorly designed websites. The design, in this case, isn’t about how the website looks, but rather how the experience is delivered to the user. Delivering that experience has become far more complicated than it was in the first decade of the web.
There are many ways that a website can be sped up. One reason for the awesome timings I get for my website is the few web requests it needs. I have just 20 requests, whereas the maximum is this sample pool is 597 requests, with the average at 181 requests. I know you can have requests that load after the webpage has largely been rendered and the user can already interact with it, but that’s not the case here.
Another big offender is the gross weight of the webpage, i.e. its total size in kilobytes. Mine weighs in at 102 kB, but the worst is 6319 kB, with an average of 3181 kB in this test pool.

That, however, is only just scratching the surface. There are more things to consider. All those tweaks you do to the server, like using SSDs, or installing some sort of software caching accelerator (e.g. WP Super Cache for WordPress sites), they are a start, but they’re still just the beginning.
The good news is that there are plenty of resources to learn, such as from the benchmark websites themselves. Google has made available some tools and resources too. Then there are some old but still relevant learning points from Yahoo. Some of these will certainly make good topics for future blog posts.
In the meanwhile, enjoy ZitSeng.com at sub-second typical speeds from Singapore.
View Comment Policy