I review many computers and smartphones on this blog. Writing the reviews for them take time, because apart from using them in a casual real-world setting, I also run a battery of tests. This enables me to get some quantitative data on their performance and characteristics.
Sometimes, a whole bunch of devices come in at one go. Like now on hand, I have the ASUS ZenBook S UX391, Dell XPS 13 9380, Microsoft Surface Laptop 2, Surface Pro 6, and Surface Go. I haven’t posted on of the reviews, and there’s also another big machine that I’m working on now.

I like to run my own benchmarks so that I have my own first hand data. This gives me my own baseline to make comparisons between devices I’ve tested. I could use manufacturers’ data, or even those of other reviewers, but there are good reasons not to. I suppose the point is for me to have my own set of data, tested under conditions I understand and can control.
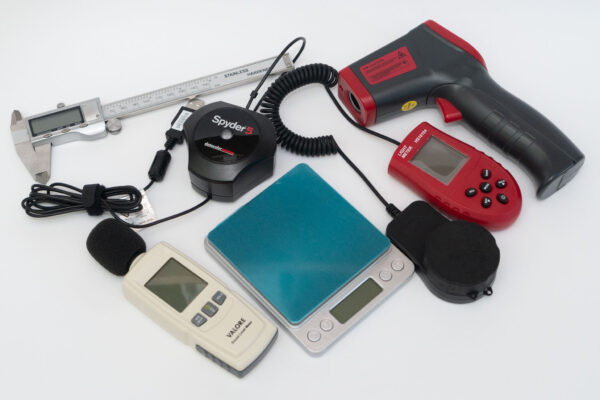
There are a number of tools I use. For notebooks and desktop displays, the most oft used tool is the Spyder5PRO colourimeter. This gives me an objective sense of the display’s colour gamut coverage. After all, how nice a display looks is otherwise going to be a very subjective matter.
I found, also, that it is useful to have my own caliper. Thickness claims made by manufacturers sometimes need more explanations. Sometimes, we might disagree about which point we should take the measurement at. For example, the thickest point might not be right when the device is significantly thinner in most other parts. On the other hand, you might care about the maximum measurement in some dimension because you need to know if the device will fit in your bag or sleeve.
None of my tools, apart from the Spyder5PRO above, are professional-grade. They are just cheap tools, stuff from AliExpess, Taobao, or Challenger’s house brand. However, they are useful nonetheless since they can still provide a useful basis for comparison. They may not be accurate, but they surely are better than subjective feel and ballpark estimations.
There is also the software side needed in my PC reviews. Last year, I wrote about some of the PC benchmark software I use: PCMark 10, PCMark 8, and Geekbench 4. Performance tests are conducted with the notebook connected to AC, and power mode set to Best Performance.
I’ve started to include 3DMark benchmark scores whenever I review a computer that has a discrete graphics processor. Gaming notebooks are getting increasingly common so some of these additional scores are useful for comparison.
Battery longevity continues to be a problem for me to benchmark. I presently use PCMark 8 Home Conventional battery test, when the power mode set to Better Battery. This test isn’t quite a true casual notebook workload, so the scores aren’t really reflective of real-world use. I sometimes share my less deterministic real-world use battery results, but I eventually hope to use a more objective tool (that is free or doesn’t cost too much).
When you do see that sometimes the numbers I post seem to disagree with manufacturers’ specifications, or even those of other reviewers, do know that I didn’t just pluck the numbers out of thin air. I tested, and they are what I got.
It’s a lot of hard work, but it makes your reviews more accurate, detailed and different from the rest!